STAT 474 | Modeling Strategy and Evaluation

From Browsing to Buying: Predicting Online Purchase Intention

A machine learning classification project using session-level e-commerce behavior to predict whether an online shopping visit ends in purchase.

12,330

shopping sessions

15.5%

purchase class share

0.922

best ROC AUC

Project Overview

Most e-commerce visitors leave without buying, but their browsing sessions contain useful signals: pages viewed, time spent, exit behavior, visitor type, seasonality, and page value. This project predicts purchase intention with the UCI Online Shoppers Purchasing Intention Dataset.

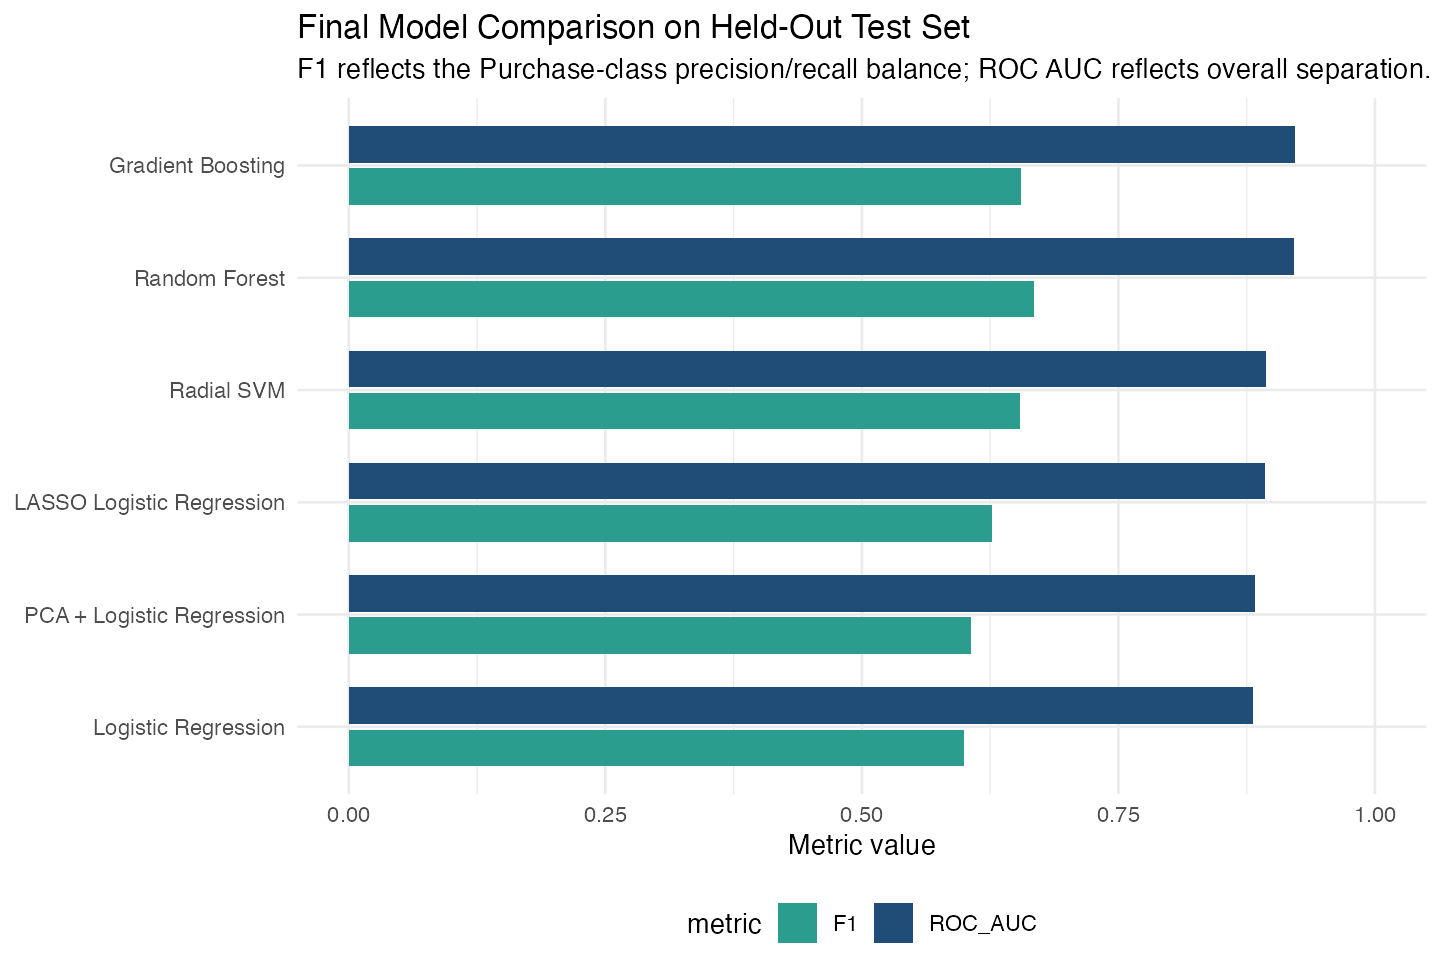
Because purchases represent only 15.5% of sessions, the final evaluation prioritizes precision, recall, F1, balanced accuracy, and ROC AUC instead of relying on accuracy alone.

Modeling Design

Decision Why it mattered
Stratified 80/20 split Preserved the minority purchase rate in both training and test data.
Six model families Compared interpretable baselines, regularization, PCA, nonlinear SVM, and tree ensembles.
5-fold cross-validation Tuned hyperparameters without using the held-out test set.
F1-oriented thresholds Matched the imbalanced business problem, where likely purchasers are the minority class.
PageValues sensitivity Checked whether model performance depended too heavily on one analytics-derived variable.

Final Test-Set Results

Model Threshold Accuracy Balanced Accuracy Precision Recall F1 ROC AUC
Gradient Boosting 0.25 0.877 0.828 0.577 0.759 0.655 0.922
Random Forest 0.30 0.882 0.836 0.590 0.769 0.667 0.921
Radial SVM 0.14 0.886 0.810 0.614 0.701 0.654 0.894
LASSO Logistic Regression 0.15 0.867 0.808 0.553 0.722 0.626 0.892
PCA + Logistic Regression 0.27 0.880 0.766 0.612 0.601 0.607 0.883
Logistic Regression 0.24 0.871 0.771 0.575 0.627 0.600 0.881

Random Forest produced the strongest F1 and balanced accuracy. Gradient Boosting produced the highest ROC AUC. Together, the results show that tree ensembles captured nonlinear intent signals better than the linear baselines.

Business Interpretation

Predicted intent groups

Random Forest probabilities separated sessions into three equal-sized groups. The high-intent group converted at 41.9%, compared with 0.4% for the low-intent group.

PageValues sensitivity

Removing PageValues reduced Random Forest ROC AUC from 0.921 to 0.762 and F1 from 0.667 to 0.414. This supports PageValues as a strong predictive signal, not a direct causal claim.

Visual Evidence

Model performance chart with F1 and ROC AUC
Tree-based models led the final ranking by F1 and ROC AUC.
Observed purchase rate by predicted intent group
The high-intent group converted at 41.9%, far above the low-intent group.
PageValues sensitivity analysis chart
Removing PageValues sharply reduced model performance across the strongest models.

Files