DATA 467 | Linear Regression

Predicting Airbnb Listing Prices in New York City

A regression project asking which listing characteristics most strongly explain Airbnb nightly prices across New York City's five boroughs.

Boxplots of log price by room type and borough group
48,895

raw listings

38,833

cleaned listings

0.507

best adjusted R2

$101

median nightly price

Project Overview

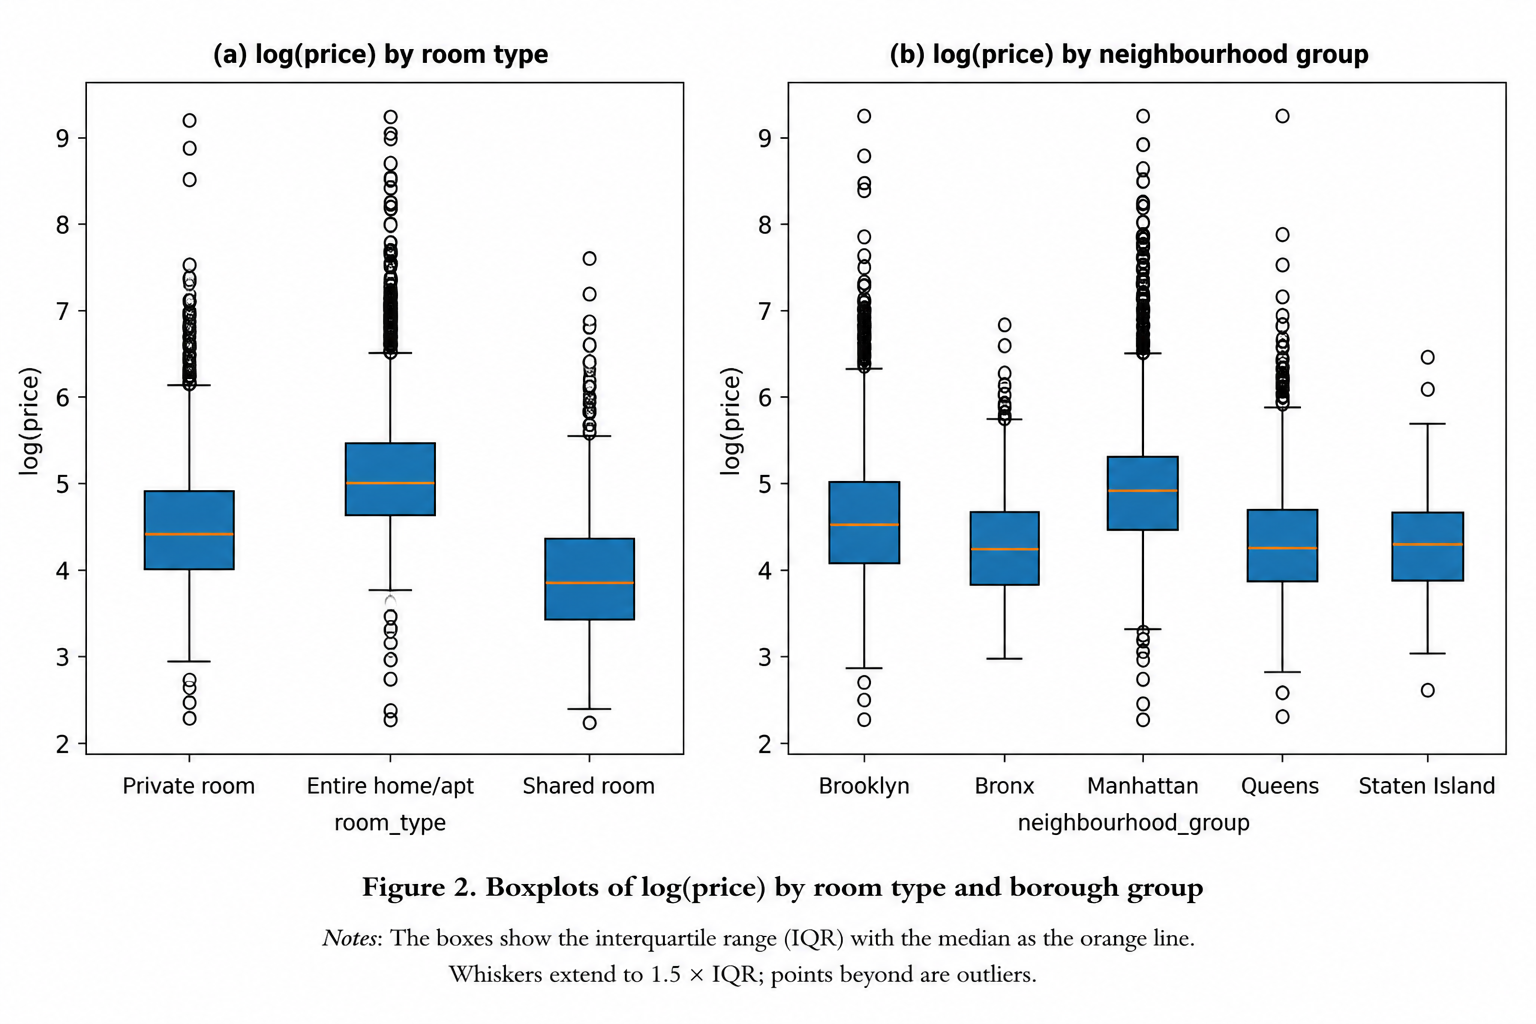
Airbnb prices reflect more than a host's chosen number. In New York City, price varies with room type, borough demand, review activity, host scale, and yearly availability. This project models nightly price using the 2019 NYC Airbnb open dataset.

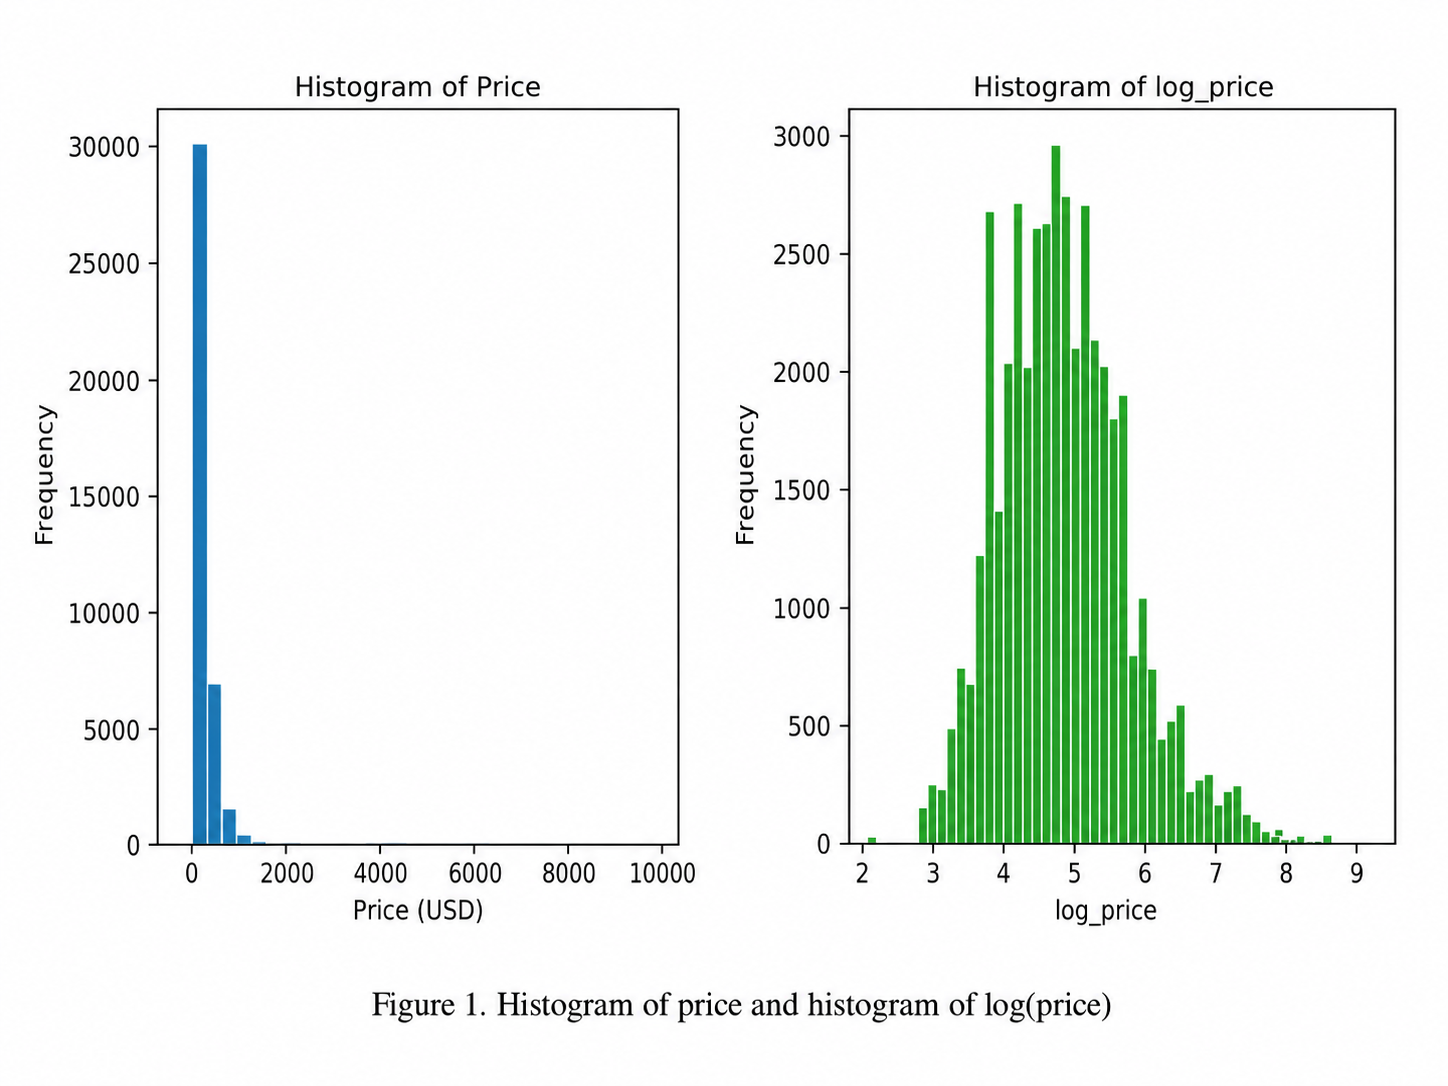
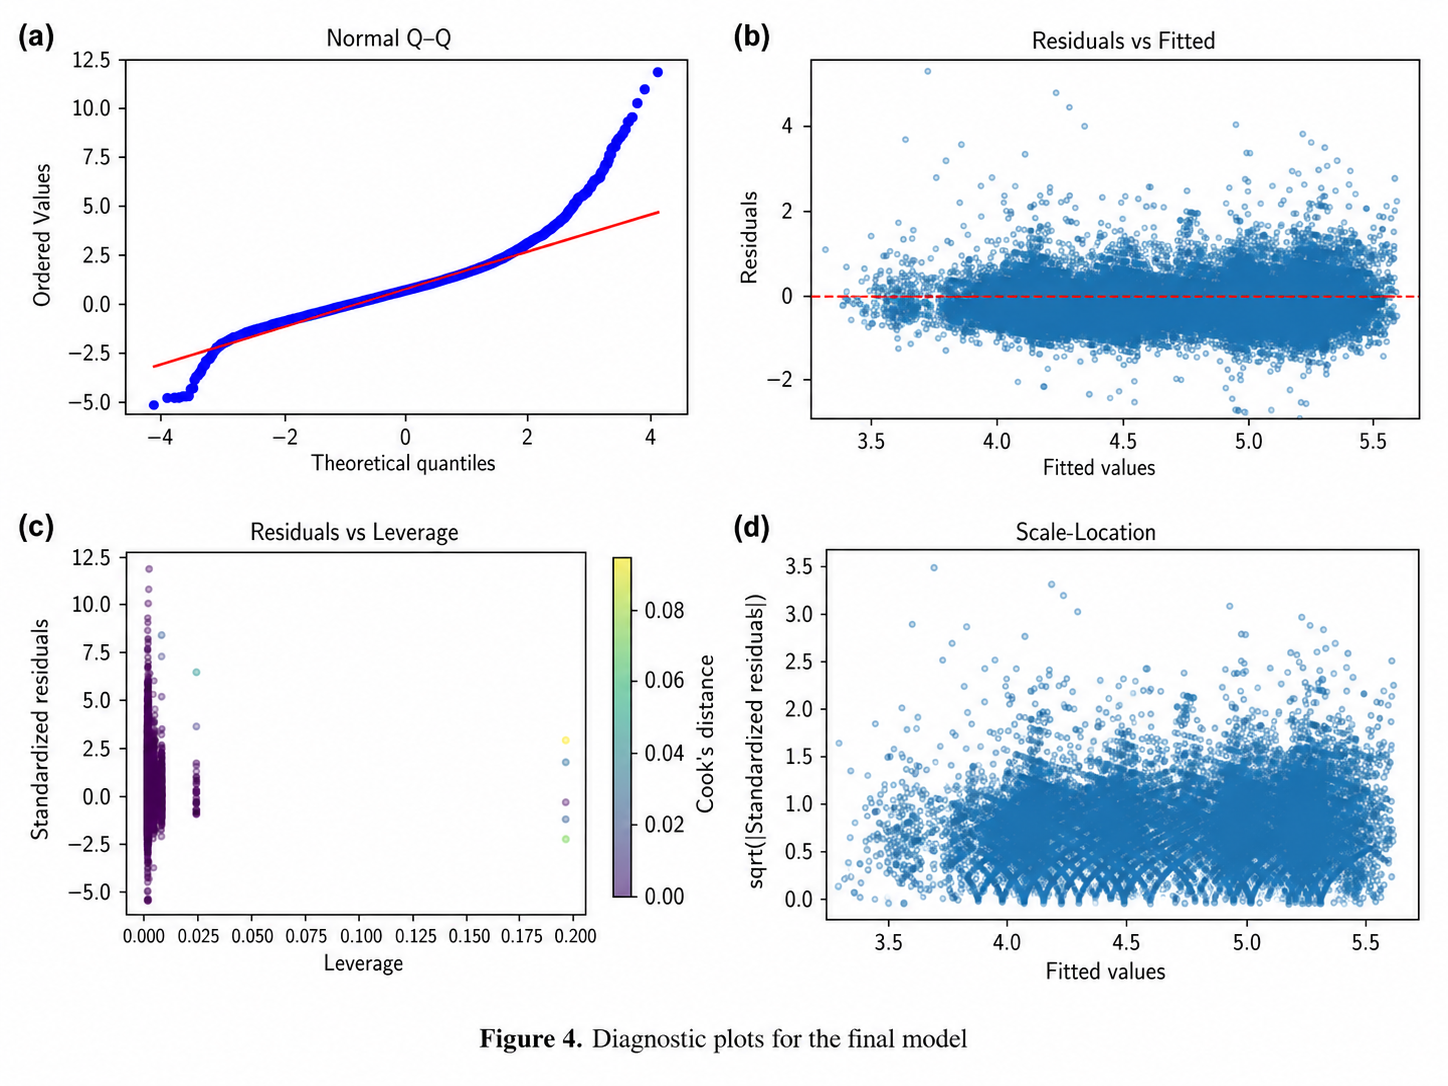
Because raw price is strongly right-skewed, the main response is log(price). The final analysis uses ordinary least squares regression, interaction terms, diagnostics, and a logistic high-price check.

Modeling Strategy

Model Specification Purpose
Model 1 log(price) using room type and borough Test whether the strongest structural factors explain price patterns.
Model 2 Add minimum nights, reviews, host listing count, and availability Check whether listing activity variables change the main story.
Model 3 Add room type by borough interaction and log-transform skewed predictors Improve predictive flexibility while keeping the model interpretable.
Logistic GLM Predict whether price is above the cleaned-sample median Confirm whether the same predictors separate high-price listings.

OLS Model Comparison

Model Adjusted R2 AIC BIC RMSE
Model 1 0.480 53000.55 53060.52 0.4787
Model 2 0.498 51591.63 51694.43 0.4700
Model 3 0.507 50910.83 51082.17 0.4658

Model 3 had the best overall fit, but the improvement over Model 2 was moderate. The main interpretation stayed stable: location and room type drove most of the signal.

Key Results

118.0%

Entire-home premium

In Model 2, entire-home listings were about 118% higher than private rooms on the expected price scale.

35.6%

Manhattan premium

Manhattan listings were about 35.6% higher than Brooklyn listings after controls.

$207

Example prediction

The notebook predicted about $207 for a representative Manhattan entire-home listing, with a wide interval.

Visual Evidence

Histograms of raw price and log price
Log transformation reduces the extreme right skew in raw price.
Boxplots of log price by room type and borough
Entire homes and Manhattan listings have visibly higher central log prices.
Scatterplots and correlation matrix for numeric predictors
Numeric activity variables add signal, but their linear patterns are weaker.
Diagnostic plots for the final OLS model
Diagnostics support broad pattern analysis, with tail departures and mild heteroscedasticity.

Files